Key Pre-feasibility Study (“PFS”) Highlights:
- The Heap Leach and Mill PFS shows construction in two stages. The combined Stage 1 and 2 contemplates a 35,000 metric tonnes per day (“mtpd”) Heap Leach in Stage 1 that will process Oxide and Mixed ore from both the DeLamar and Florida Mountain Deposits, and a 6,000 mtpd Mill to be constructed in Stage 2 to process Non-Oxide ore:
- Heap Leach and Mill PFS after-tax NPV(5%) of US$412 million and 27% after-tax IRR at US$1,700/ounce (“oz”) Gold (“Au”) and US$21.50/oz Silver (“Ag”) (base case).
- Heap Leach and Mill PFS after-tax NPV(5%) of US$539 million and 33% after-tax IRR at Spot Prices (February 8, 2022) of US$1,826 /oz Au and US$23.00/oz Ag.
- Pre-production capital expenditures (“Capex”) of US$282 million, including contingency of 20% on processing, heap leach and tailing facilities (excluding working capital and assuming mobile mining equipment financing).
- Average annual production of 163,000 oz gold equivalent (“AuEq”)1 for first 8 years with Life of Mine (“LOM”) average annual production of 110,000 oz Au Eq over 16 years.
- LOM site level all-in sustaining costs of (“AISC”) of US$955/oz on an AuEq co-product basis.
- Strong leverage to silver; silver accounts for ~35% of revenue from production.
- Proven and Probable Mineral Reserves of 1.8 M oz Au (at 0.45 g/t Au) and 92.4 M oz Ag (at 23.27 g/t Ag).
- Total LOM Strip Ratio (waste to ore) of 2.21.
- Mill construction will commence in Year 1 at the discretion of the Company and is expected to be financed with internal cash flows. Mill construction in Stage 2 can be pushed out as necessary.
- Stage 1 Heap Leach Only: The Company contemplates beginning the project with Stage 1 Heap Leaching in year 1. Stage 1 includes a 35,000 mtpd Heap Leach of Oxide and Mixed ore. Stage 1 will permit Integra to commence development and operation of the project at lower cash costs and give the Company flexibility to proceed or not proceed with Stage 2 in year 1. Stage 1 offers a robust production profile while requiring significantly lower expansion capital than a combined Heap Leach and Milling development:
- Heap Leach Only (Stage 1) pre-production Capex of US$273 million (excluding working capital and assuming mobile mining equipment financing).
- LOM site level AISC of US$813 /oz on an AuEq co-product basis
- Average annual production of 136,000 oz AuEq over 7 years
- Total LOM Strip Ratio (waste to ore): 1.35
- Integra believes that a two-stage development reduces risk because of the greater flexibility to respond to the prevailing economic environment in connection with a decision to pursue Stage 2.
- The PFS includes multiple sustainability-driven initiatives to decrease the environmental footprint of the Project, including:
- Railveyor: The Project’s ore haulage system will utilize Railveyor’s light rail system to haul material between various pits and the processing location, replacing the equivalent of approximately 5 diesel haul trucks. Powered electrically, Railveyor will decrease the Project’s diesel usage and associated direct (Scope 1) greenhouse gas emissions. Downhill portions of the haul will generate power regeneratively, and ancillary benefits will include reduced noise and dust levels, and reduced water consumption for dust mitigation.
- Power Generation: The Company plans to power the Project through an onsite microgrid. A 12-megawatt (“MW”) solar array will be installed on the historic tailing impoundment in conjunction with 4.5 MW-hours of batteries and a Liquified Natural Gas (“LNG”) power generation plant to be constructed on site, leased from, and maintained by a third-party provider through a long-term use-based lease agreement. Greenhouse gas emissions from this energy mix will be an estimated 13% lower than the current local utility grid mix. The microgrid levelized cost of energy (“LCOE”) is 63% lower than the local electric utility.
- The incorporation of these plans is not only crucial to lowering the Project’s greenhouse gas emissions, but they also importantly drive stronger economics for the Project, demonstrating how mining projects can benefit economically from taking steps towards sustainability.
VANCOUVER, British Columbia, Feb. 09, 2022 (GLOBE NEWSWIRE) -- Integra Resources Corp. (“Integra” or the “Company”) (TSX-V: ITR; NYSE American: ITRG) is pleased to announce the results of the Pre-feasibility Study (“PFS”) and Mineral Resource and Reserve Statement on its 100% owned DeLamar Project completed by Mine Development Associates, a division of RESPEC of Reno, Nevada, supported by M3 Engineering & Technology Corporation of Chandler, Arizona, McClelland Laboratories, Welsh Hagen Associates, and EM Strategies, a WestLand Resources, Inc, Company, all of Reno, Nevada, Warm Springs Consulting, LLC of Boise, Idaho, and Elbow Creek Engineering of Billings, Montana, for the DeLamar Project (“DeLamar” or the “Project”) located in southwestern Idaho.
George Salamis, Integra Resources President and CEO reports: “The completion of the DeLamar Pre-feasibility study is a crowning achievement for the Company, representing the culmination of two years of work by the Integra team and its various consultants. Following on from the success of the 2019 preliminary economic assessment, this PFS is a materially different and larger scale Project, both in Heap Leaching and Milling, relative to the PEA. Despite inflationary pressure currently overhanging the mining industry from a capital and operating cost perspective, the Project continues to demonstrate strong positive economics and a high degree of optionality in terms of the scale, mining/processing scope and capital cost of gold/silver mines to be built at the Project. The two-stage Project contemplates a larger scale open pit mining scenario that combines Heap Leaching and Milling to achieve an average production level of 163,000 AuEq ozs per annum for the first 8 years, a mine life of 16 years, life of mine site level AISC of $955/oz (co-product basis) and with a clear path to future Non-Oxide processing enhancements and resource growth upside.” Mr. Salamis continues, “the staged approach to development also means that the Company starts production with Heap Leach only that can be developed with far lower capital and operating cost requirements, capable of producing an average of 136,000 AuEq ozs per annum at a site level AISC $813/oz (co-product basis). We believe that in an inflationary environment, such as the one that our shareholders and stakeholders are currently experiencing, having a multi-phase development stage is critically important, and demonstrates maximum flexibility and transparency. This study also outlines the potential for significant upside opportunities at the DeLamar Project, including increased gold and silver recoveries in the Non-Oxide ore through the use of Albion processing methods, a process that has much lower capital costs than traditional Oxidation plants and has yielded promising results in recent test work. Additionally, this study does not incorporate any of the high-grade gold-silver potential below the Florida Mountain resource envelope.”
Integra will host a call on February 10, 2022, at 8am PST/11am EST. To register for the webinar, click on the following link: https://us02web.zoom.us/webinar/register/WN_VUvizkuaSlykvDQGzaSWaQ
1. DeLamar Project Global (DeLamar + Florida Mountain) Gold and Silver Reserves
Mineral Resources
Table 1 shows the updated Mineral Resource estimate included in the PFS.
Table 1: Mineral Resource Estimate
| Resources | | | | | | | | | | | | |
| | Oxide | Mixed | Non-Oxide |
| Florida Mountain | Measured | Indicated | Meas+ Ind | Inferred | Measured | Indicated | Meas+ Ind | Inferred | Measured | Indicated | Meas+ Ind | Inferred |
| K Tonnes | 1,361 | 14,302 | 15,663 | 4,516 | 5,498 | 34,098 | 39,596 | 5,292 | 2,119 | 16,009 | 18,128 | 4,663 |
| g Au/t | 0.39 | 0.36 | 0.36 | 0.25 | 0.47 | 0.39 | 0.40 | 0.28 | 0.40 | 0.44 | 0.43 | 0.32 |
| K Ozs Au | 17 | 164 | 181 | 37 | 82 | 425 | 507 | 48 | 27 | 225 | 252 | 48 |
| g Ag/t | 13.7 | 9.7 | 10.1 | 6.6 | 14.6 | 10.1 | 10.7 | 6.6 | 10.9 | 10.5 | 10.5 | 9.0 |
| K Ozs Ag | 599 | 4,467 | 5,066 | 958 | 2,584 | 11,064 | 13,648 | 1,126 | 741 | 5,399 | 6,140 | 1,343 |
| DeLamar Deposit | | | | | | | | | | | | |
| K Tonnes | 2,846 | 25,939 | 28,785 | 5,163 | 3,490 | 27,556 | 31,046 | 2,631 | 13,729 | 53,301 | 67,030 | 18,350 |
| g Au/t | 0.34 | 0.31 | 0.32 | 0.26 | 0.42 | 0.33 | 0.34 | 0.29 | 0.53 | 0.46 | 0.48 | 0.42 |
| K Ozs Au | 31 | 262 | 293 | 44 | 47 | 290 | 337 | 25 | 234 | 793 | 1,027 | 250 |
| g Ag/t | 17.7 | 17.0 | 17.1 | 11.1 | 37.3 | 23.0 | 24.6 | 11.4 | 37.2 | 26.5 | 28.7 | 17.2 |
| K Ozs Ag | 1,616 | 14,170 | 15,786 | 1,838 | 4,181 | 20,337 | 24,518 | 967 | 16,407 | 45,403 | 61,810 | 10,126 |
| Total DeLamar Deposit | | | | | | | | | | | |
| K Tonnes | 4,207 | 40,241 | 44,448 | 9,679 | 8,988 | 61,654 | 70,642 | 7,923 | 15,848 | 69,310 | 85,158 | 23,013 |
| g Au/t | 0.36 | 0.33 | 0.33 | 0.26 | 0.45 | 0.36 | 0.37 | 0.28 | 0.51 | 0.46 | 0.47 | 0.40 |
| K Ozs Au | 48 | 426 | 474 | 81 | 129 | 715 | 844 | 73 | 261 | 1,018 | 1,279 | 298 |
| g Ag/t | 16.4 | 14.4 | 14.6 | 9.0 | 23.4 | 15.8 | 16.8 | 8.2 | 33.7 | 22.8 | 24.8 | 15.5 |
| K Ozs Ag | 2,215 | 18,637 | 20,852 | 2,796 | 6,765 | 31,401 | 38,166 | 2,093 | 17,148 | 50,802 | 67,950 | 11,469 |
Notes:
(1) All estimates of Mineral Resources have been prepared in accordance with NI 43-101.
(2) Mineral Resources that are not Mineral Reserves do not have demonstrated economic viability.
(3) Mineral Resources are reported inclusive of Mineral Reserves.
(4) Michael Gustin, MDA a division of RESPEC of Reno, Nevada, is a Qualified Person as defined in NI 43-101, is responsible for reporting Mineral Resources for the DeLamar Project. Mr. Gustin is independent of the Company.
(5) The DeLamar and Florida Mountain Deposit Mineral Resources have been constrained to lie within optimized pit shells created using metal prices of US$1,800/ounce of gold and US $21/ounce of silver.
(6) Oxidize and Mixed Mineral Resources are reported at a 0.17 g AuEq/t cut-off in consideration of potential open-pit mining and Heap Leach processing. Non-Oxide Mineral Resources are reported at a 0.3 g AuEq/t cut-off at DeLamar in consideration of potential open pit mining and grinding, flotation, ultra-fine regrind of concentrates, and Albion cyanide-leach processing of the reground concentrates. Non-Oxide Mineral Resources at Florida Mountain are reported at a 0.2 g AuEq/t cut-off in consideration of potential open pit mining and grinding, flotation, ultra-fine regrind of concentrates, and agitated cyanide-leaching for the Non-Oxide materials.
(7) Additional inputs for the pit-optimizations include: Mining - US$2.20/tonne mined; Heap Leaching - US$2.75/t for Oxide materials, US$3.75/t for Mixed materials at DeLamar and US$3.50/t at Florida Mountain; Non-Oxide Processing - US$15.65/t at DeLamar and US$9.45/t at Florida Mountain; G&A - US$0.40/t processed by Heap Leaching and $0.50/t for processing of Non-Oxide materials; Heap Leach Gold Recoveries – 85% / 45% for Au / Ag Oxide and 80% / 40% for Mixed at DeLamar, 90% / 65% for Au / Ag Oxide and 85% / 55% for Mixed at Florida Mountain; and Non Oxide Recoveries - 78% / 78% for Au / Ag at Glen Silver area of DeLamar, 87% / 87% for all other DeLamar areas, and 95% / 92% for Au / Ag at Florida Mountain.
(8) Gold equivalent grades are calculated using the formula g/t AuEq = g/t Au + (g/t Ag/Factor), with the factor reflecting the metal recoveries by oxidation and metal prices provided above. The gold equivalent grades were used solely in the application of the resource cut-offs.
(9) The effective date of the Mineral Resource estimate is March 1, 2021.
(10) Rounding as required by reporting guidelines may result in apparent discrepancies between tonnes, grades, and contained metal content.
(11) The estimate of Mineral Resources may be materially affected by geology, environment, permitting, legal, title, taxation, sociopolitical, marketing, or other relevant issues.
Mineral Reserves
Table 3 shows the proven and probable reserves for both Heap Leach and Mill ore by deposit. The reserves were estimated using block value calculated based on metal price and recoveries by area and oxidation. The cost to process the material was then used as a cut-off grade. The metal prices used to calculate the block values were $1,600 per ounce gold and $21.00 per ounce silver, though the final cash-flow model used $1,700 per ounce gold and $21.50 per ounce silver. The block value calculation equation is shown in Equation 1 in the footnotes. The block value was calculated for both gold and silver and then each was added together to provide an overall value for each block.
Recoveries used for the block value calculations are shown in Table 2 and were provided by Jack McPartland a member of MMSA, with a special expertise in metallurgy/processing, of McClelland Laboratories of Reno, Nevada. The recoveries for Florida Mountain Non-Oxide material used grade dependent equations shown in Equations 2 and 3 in the footnotes for gold and silver respectively.
Table 2 – Reserve Gold and Silver Recoveries
| | Oxide | Mixed | Non-Oxide |
| Recoveries by Area | Au | Ag | Au | Ag | Au | Ag |
| Florida Mountain | 89% | 49% | 72% | 47% | Eq. 2 | Eq. 3 |
| Sullivan Gulch | 86% | 20% | 61% | 39% | 38% | 73% |
| DeLamar | 78% | 11% | 61% | 42% | 39% | 87% |
| Sommerset | 87% | 15% | 58% | 44% | 39% | 87% |
| Glen Silver | 70% | 18% | 63% | 30% | 28% | 64% |
| South Wahl | 77% | 37% | 50% | 74% | 39% | 87% |
| Milestone | 75% | 18% | 45% | 18% | 39% | 87% |
Table 3: Mineral Reserves
| | Leach | Mill | Total |
| Florida Mountain | Proven | Probable | P&P | Proven | Probable | P&P | Proven | Probable | P&P |
| K Tonnes | | 5,789 | | 39,919 | | 45,708 | | 1,306 | | 9,249 | | 10,555 | 7,095 | 49,168 | | 56,263 |
| g Au/t | | 0.50 | | 0.42 | | 0.43 | | 0.48 | | 0.54 | | 0.53 | 0.50 | 0.44 | | 0.45 |
| K Ozs Au | | 94 | | 541 | | 635 | | 20 | | 160 | | 180 | 114 | 701 | | 815 |
| g Ag/t | | 16.02 | | 10.73 | | 11.40 | | 12.24 | | 12.27 | | 12.26 | 15.32 | 11.02 | | 11.56 |
| K Ozs Ag | | 2,981 | | 13,768 | | 16,749 | | 514 | | 3,648 | | 4,162 | 3,495 | 17,417 | | 20,911 |
| Block Value | $ | 24.75 | $ | 20.18 | $ | 20.76 | $ | 26.72 | $ | 29.37 | $ | 29.04 | 25.12 | 21.91 | $ | 22.31 |
| DeLamar Deposit | | | | | | | | | |
| K Tonnes | | 5,247 | | 41,285 | | 46,533 | | 6,016 | | 14,672 | | 20,688 | 11,263 | 55,958 | | 67,221 |
| g Au/t | | 0.41 | | 0.35 | | 0.36 | | 0.69 | | 0.63 | | 0.65 | 0.56 | 0.43 | | 0.45 |
| K Ozs Au | | 69 | | 471 | | 540 | | 133 | | 299 | | 432 | 202 | 770 | | 972 |
| g Ag/t | | 31.24 | | 22.07 | | 23.10 | | 62.03 | | 52.86 | | 55.52 | 47.69 | 30.14 | | 33.08 |
| K Ozs Ag | | 5,270 | | 29,290 | | 34,560 | | 11,998 | | 24,934 | | 36,931 | 17,268 | 54,223 | | 71,491 |
| Block Value | $ | 19.83 | $ | 16.19 | $ | 16.60 | $ | 42.07 | $ | 36.62 | $ | 38.20 | 31.71 | 21.54 | $ | 23.25 |
| Total DeLamar Project | | | | | | | | |
| K Tonnes | | 11,036 | | 81,205 | | 92,241 | | 7,321 | | 23,921 | | 31,243 | 18,358 | 105,126 | | 123,483 |
| g Au/t | | 0.46 | | 0.39 | | 0.40 | | 0.65 | | 0.60 | | 0.61 | 0.54 | 0.44 | | 0.45 |
| K Ozs Au | | 163 | | 1,012 | | 1,175 | | 153 | | 459 | | 612 | 316 | 1,471 | | 1,787 |
| g Ag/t | | 23.25 | | 16.49 | | 17.30 | | 53.15 | | 37.16 | | 40.91 | 35.18 | 21.20 | | 23.27 |
| K Ozs Ag | | 8,251 | | 43,058 | | 51,310 | | 12,511 | | 28,582 | | 41,093 | 20,763 | 71,640 | | 92,403 |
| Block Value | | 22.41 | | 18.15 | $ | 18.66 | | 39.33 | | 33.81 | $ | 35.11 | 29.16 | 21.71 | $ | 22.82 |
Notes:
(1) All estimates of Mineral Reserves have been prepared in accordance with National Instrument 43 - 101 – Standards of Disclosure for Mineral Projects (“NI 43-101”).
(2) Thomas L. Dyer, PE, MDA a division of RESPEC of Reno, Nevada, is a Qualified Person as defined in NI 43-101, is responsible for reporting Proven and Probable Mineral Reserves for the DeLamar Project. Mr. Dyer is independent of the Company.
(3) Mineral Reserves are based on prices of $1,650 per ounce Au and $21.00 per ounce Ag. The reserves were defined based on pit designs that were created to follow optimized pit shells created in Whittle. Pit designs followed pit slow recommendations provided by RESPEC.
(4) Reserves are reported using block value cut-off grades representing the cost of processing:
Florida Mountain Oxide Leach cut-off grade of used is $3.55/t.
Florida Mountain Mixed Leach cut-off grade of used is $4.20/t.
Florida Mountain Non-Oxide Mill cut-off grade of used is $10.35/t.
DeLamar Oxide Leach cut-off grade of used is $3.65/t
DeLamar Mixed Leach cut-off grade of used is $4.65/t.
DeLamar Non-Oxide Mill cut-off grade of used is $15.00/t.
(5) The Mineral Reserves point of reference is the point where is material is fed into the crusher.
(6) The effective date of the Mineral Reserves estimate is January 24, 2022.
(7) All ounces reported herein represent troy ounces; “g Au/t” represents grams of gold per tonne and “g Ag/t” represents grams of silver per tonne.
(8) Columns may not sum due to rounding.
(9) The estimate of Mineral Reserves may be materially affected by geology, environment, permitting, legal, title, taxation, sociopolitical, marketing, or other relevant issues
(10) Energy prices of US$2.50 per gallon of diesel and US$0.065 per kWh were used.
(11) Additional supporting details regarding the information in this news release will be provided in the pre-feasibility study to be available on SEDAR within 45 days of this news release.
(12) Additional supporting details regarding the information in this news release will be provided in the pre-feasibility study to be available on SEDAR within 45 days of this news release.
(13) Equation 1: Block value calculation: https://www.globenewswire.com/NewsRoom/AttachmentNg/3603faa0-1d71-4349-83ac-a2616ce90212
(14) Equation 2: Florida Mountain Non-Oxide Gold Recovery (Where the maximum gold recovery = 87%) https://www.globenewswire.com/NewsRoom/AttachmentNg/40219cdd-0979-4728-b8a0-9fcd8fabf1da
(15) Equation 3: Florida Mountain Non-Oxide Silver Recovery (Where the maximum silver recovery = 77%) https://www.globenewswire.com/NewsRoom/AttachmentNg/807975f8-2cb7-44c5-a486-008df235cf47
The resources are supported by 258,318 meters of drilling, 131,271 meters at the DeLamar Deposit and 127,047 meters at the Florida Mountain Deposit. This drilling is a combination of historical drilling and drilling completed by Integra Resources.
2. Stage 1 and 2 Development: PFS Overview - Heap Leach and Mill
The PFS contemplates an open pit mine with on-site treatment of Oxide and Mixed ores via a 35,000 mtpd Heap Leach facility at 80% passing 12.7 mm (0.5 inch), and treatment of a portion of the Non-Oxide mineralization through a 6,000 mtpd Mill utilizing conventional grind, flotation, re-grinding and cyanidation of the concentrate. In year 1, Heap Leaching of Florida Mountain ore will commence, with Mill construction beginning in year 1 and production starting in year 3. In year 2, Oxide and Mixed ore from the DeLamar Deposit will be mined with the Non-Oxide ore being accessed from the DeLamar and Florida Mountain Deposits starting in year 3. In total, the Project will process 123,483,000 tonnes of ore over a 16-year mine life producing 1,154,431 oz Au and 49,995,640 oz Ag (1,786,729 oz AuEq). The strip ratio over LOM, waste-to-ore, is 2.21.
The PFS is derived from the Company’s pit-constrained Mineral Reserve estimate with an effective date of January 24, 2022 and does not include results from drilling completed in 2021. The effective date of the PFS is January 24, 2022 and a technical report will be filed on the Company’s website and SEDAR within 45 days of this news release.
DeLamar Project Heap Leach and Mill PFS Highlights:
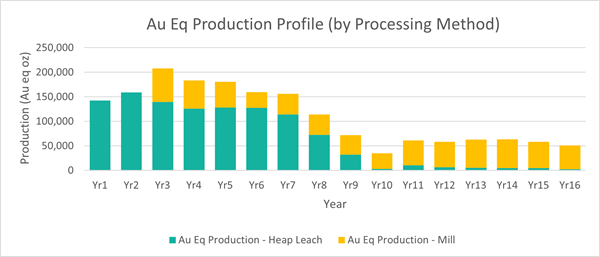
- Year 1 to Year 8 average annual production of 121,000 0 oz Au and 3.3 million oz Ag (163,000 oz AuEq).
- LOM (Year 1 to Year 16) average annual production of 71,000 oz Au and 3.1 million oz Ag (110,000 oz AuEq).
- After-tax IRR of 27%.
- After-tax NPV (5%) of US$412 million.
- US$695 million after-tax LOM cumulative cash flow.
- 35,000 mtpd open pit/Heap Leach production rate with an initial mine life of 16 years, sourcing Oxide and Mixed ore from both the Florida Mountain and DeLamar Deposits.
- 6,000 mtpd Mill, commencing in Year 3, primarily sourcing Non-Oxide ore from the Florida Mountain Deposit and then from the DeLamar Deposit over a 15-year period.
- LOM site level AISC of US$547/oz net of silver by-product or US$955/oz on an Au Eq co-product basis.
- LOM strip ratio of 2.21 (Waste: Ore).
- Low pre-production Capex of US$282 million (excluding working capital/bonding; assuming mobile equipment financing).
- LOM capital expenditures (pre-production + expansion/sustaining capital) of US$576 million
- After-tax payback period of 3.3 years.
- Mill expansion capital expected to be financed with internal cash flows.
Table 4: DeLamar Project Heap Leach and Mill PFS Detailed Assumptions:
| Contained Metals |
| Contained Gold ounces (000's oz) | 1,787 |
| Contained Silver ounces (000's oz) | 92,403 |
| Contained AuEq ounces (000's oz) | 2,955 |
| Mining |
| Mine Life | 16 years |
| Strip Ratio (Waste: Ore) | 2.21 |
| Total Tonnage Mined (000's mt) | 396,701 |
| Total Ore Mined (000's mt) | 123,483 |
| Processing |
| Processing Throughput: Heap-Leaching/Milling | 35,000 mtpd / 6,000 mtpd |
| Average Diluted Gold Grade (g/t) - HL | 0.40 |
| Average Diluted Silver Grade (g/t) - HL | 17.30 |
| Average Diluted AuEq Grade (g/t) - HL | 0.62 |
| Average Diluted Gold Grade (g/t) - Milling | 0.61 |
| Average Diluted Silver Grade (g/t) - Milling | 40.91 |
| Average Diluted AuEq Grade (g/t) - Milling | 1.13 |
| Production |
| Heap Leach Recovery |
| Florida Heap Leach Recovery (%) - Gold | 76% |
| DeLamar Heap Leach Recovery (%) - Gold | 66% |
| Florida Heap Leach Recovery (%) - Silver | 47% |
| DeLamar Heap Leach Recovery (%) - Silver | 32% |
| Mill Recovery |
| Florida Mill Recovery (%) - Gold | 83% |
| DeLamar Mill Recovery (%) - Gold | 37% |
| Florida Mill Recovery (%) - Silver | 72% |
| DeLamar Mill Recovery (%) - Silver | 75% |
| Payable Metals |
| LOM Payable Gold ounces (000's oz) | 1,149 |
| LOM Payable Silver ounces (000's oz) | 49,746 |
| LOM Payable AuEq ounces (000's oz) | 1,778 |
| Years 1-8 Avg Annual Production - Gold (000's oz) | 121 |
| Years 1-8 Avg Annual Production - Silver (000's oz) | 3,312 |
| Years 1-8 Avg Annual Production - AuEq (000's oz) | 163 |
| Years 1-16 Avg. Annual Production - Gold (000's oz) | 71 |
| Years 1-16 Avg. Annual Production - Silver (000's oz) | 3,085 |
| Years 1-16 Avg. Annual Production - AuEq (000's oz) | 110 |
| Costs per Tonne |
| Mining Costs ($/t mined) | $1.89 |
| Mining Costs ($/t processed) | $6.08 |
| Processing Costs ($/t heap leached) – HL | $3.74 |
| Processing Costs ($/t milled) – Milling | $12.57 |
| Processing Costs ($/t processed) – Combined | $5.99 |
| G&A Costs ($/t processed) | $0.86 |
| Total Site Operating Cost ($/t processed) | $12.92 |
| Cash Costs1 |
| LOM Cash Cost ($/oz) Au, net-of-silver by-product | $497 |
| LOM Cash Cost ($/oz) AuEq, co-product | $923 |
| LOM Site Level AISC ($/oz) Au, net-of-silver by-product | $547 |
| LOM Site Level AISC ($/oz) AuEq, co-product | $955 |
| Capital Expenditures |
| Initial Capital Expenditures ($ MM)2 | $281.9 |
| Working Capital / Reclamation Bond ($ MM)3 | $25.6 |
| Non-Ox Mill (Plant & Tailing LOM) ($ MM) | $194.6 |
| Other Sustaining Capex / Equipment Financing Pmts ($ MM) | $99.9 |
| Reclamation Cost ($ MM) | $30.8 |
| Salvage Value ($ MM) | ($23.7) |
| Economic Assumptions |
| Gold Price | $1,700 |
| Silver Price | $21.50 |
| Exchange Rate (US$/C$) | 1.25 |
| Economics4 |
| After-Tax IRR | 27% |
| NPV (5%) (US$ million) | $412.3 |
| NPV (5%) (C$ million) | $515.4 |
| Payback period | 3.33 |
| Average Annual net free cash flow (US$ million) | $60.2 |
| LOM net after-tax free cash flow (US$ million) | $695.0 |
Notes:
(1) Cash costs and AISC are non-GAAP measures. See reference below regarding non-GAAP measures.
(2) Assumes equipment financing for primary equipment only (10% cash deposit)
(3) Working capital and reclamation bonding returned in year 17. Reclamation bond assumes 20% cash collateral.
(4) Free cash flow is a non-GAAP measure. See references below regarding non-GAAP measures.
Gold Equivalent Production Profile (breakdown by processing method):
A chart accompanying this announcement is available at https://www.globenewswire.com/NewsRoom/AttachmentNg/8c1bcb43-e347-45c1-a45a-30d0edf18b9b
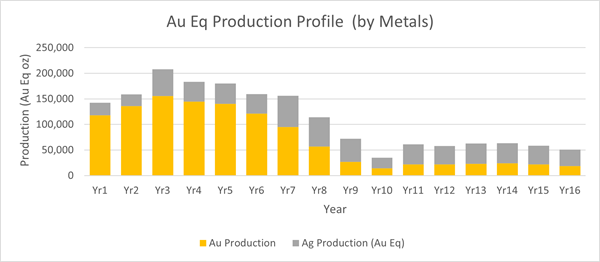
Gold Equivalent Production Profile (breakdown by metals):
A photo accompanying this announcement is available at https://www.globenewswire.com/NewsRoom/AttachmentNg/a255774f-d8ed-4bab-9c6f-2553ba7863a3
Sensitivities to Gold and Silver Prices:
The table below illustrates a range of metal pricing scenarios on an after-tax basis to evaluate the economics of the Project. As shown, the Project remains very viable in the downside commodity price scenario and as well, is extremely robust in the upside case.
Table 5: Metal Price Sensitivities
| $/oz Au | $/oz Ag | NPV (5%) | NPV (8%) | NPV (10%) | IRR | Payback |
| $ | 1,500 | $ | 18.97 | $203.4 | $127.4 | $87.9 | 16% | 4.26 |
| $ | 1,550 | $ | 19.60 | $255.8 | $171.2 | $127.1 | 19% | 3.92 |
| $ | 1,600 | $ | 20.24 | $308.5 | $215.1 | $166.3 | 22% | 3.69 |
| $ | 1,650 | $ | 20.87 | $360.3 | $258.1 | $204.7 | 25% | 3.50 |
| $ | 1,700 | $ | 21.50 | $412.3 | $301.5 | $243.4 | 27% | 3.33 |
| $ | 1,750 | $ | 22.13 | $464.0 | $344.5 | $281.8 | 30% | 3.17 |
| $ | 1,800 | $ | 22.76 | $514.9 | $386.7 | $319.5 | 32% | 3.03 |
| $ | 1,850 | $ | 23.40 | $565.6 | $428.9 | $357.0 | 34% | 2.92 |
| $ | 1,900 | $ | 24.03 | $616.4 | $471.1 | $394.7 | 37% | 2.82 |
| $ | 1,950 | $ | 24.66 | $667.3 | $513.4 | $432.4 | 39% | 2.72 |
| $ | 2,000 | $ | 25.29 | $718.2 | $555.8 | $470.3 | 41% | 2.63 |
Operations
Over 300 mining, processing, maintenance, and general administrative people will be employed directly by the Project in peak years making it a significant contributor to the economy of Owyhee County, located in southwest Idaho. The PFS does not contemplate the need for an expanded mining camp facility during development and operation as it is expected that a significant portion of the employee base will be hired from Owyhee County and Malheur County, Oregon.
Mining
The Company expects to finance the mining equipment for the operation. The primary fleet consists of two 23 m3 hydraulic shovels, sixteen 136 tonne haul trucks, five production drills and ancillary support equipment. In addition, the Railveyor system will provide the majority of ore hauling from pit to processing, replacing approximately 5 haul trucks.
Metallurgy
The process flowsheets for both the Heap Leach and Milling circuits have been designed around historical test work from the 2019 PEA and metallurgical studies completed in 2020 and 2021.
The most recent program was designed to confirm and optimize the 2019 PEA flowsheets and incorporate the DeLamar Non-Oxide mineralization. The work was completed by McClelland Laboratories, Inc. (MLI) in Sparks, Nevada.
The Florida Mountain and DeLamar Deposits are distinctly different metallurgically, both in the Heap Leach ores (Oxide and Mixed) and the Mill ore (Non-Oxide). Separate mirrored metallurgical test programs were run for Heap and Mill feeds from both ore bodies.
Heap Leach Test Work
The Florida Mountain Heap Leach testing comprised of 47 variability Bottle Roll Tests ("BRTs”) plus 7 additional BRTs on Non-Oxidized material, while 38 composites were created for DeLamar. These composites were selected to cover the deposit spatially, by depth, by grade, and by lithology. In general, six meter (20 ft) intervals were used to mimic the expected bench height. These tests showed little variability for the Florida Mountain Heap Leach feed; while the DeLamar Heap Leach ores showed significant variability by zone.
This Column Leach Test (“CLT”) program included 11 composites for Florida Mountain and 12 for DeLamar selected based on results from the BRT variability program. Kinetic BRTs were performed on each composite. Multiple composites from each deposit were run at both 50mm (2 inches) and 12.7mm (0.5 inch), and a Florida Mountain Mixed master composite was crushed to 9.5mm (0.375 inch) using a single pass through a high-pressure grinding rolls (HPGR), and column leached for size sensitivity analysis.
Economic analysis of the results from these programs, in conjunction with the PEA metallurgical testing, yielded a 12.7mm (0.5 inch) crush size selection. This is down from 50mm (2 inches) for Florida Mountain in the PEA, but confirmed the PEA crush size for DeLamar. Load-permeability testing on 12.7mm (0.5 inch) column residues resulted in no agglomeration requirements for Florida Mountain and agglomeration for 45% of DeLamar ore.
Milling Test Work
Mill testing was completed on seven composites from Florida Mountain and twelve composites from DeLamar. Kinetic mill/cyanidation whole ore leach BRT’s were completed on each Florida Mountain composite at 1.7mm (10 Mesh (M)) and 75µm (200M). DeLamar and Florida Mountain composites were also used for flotation variability testing.
Florida Mountain master composites were created for whole ore flotation versus gravity concentration with flotation of the gravity tailing comparison at various grind sizes. Flotation tailing leach tests were also completed on these composites. Rougher flotation at a P80 of 150µm gave equivalent results to gravity concentration with flotation of the tailing. Finer grind sizes yielded no appreciable flotation recovery improvements for either ore body. Leaching of the flotation tailing proved uneconomic due largely to the very high flotation recoveries of gold and silver to the concentrate. Flotation optimization on DeLamar master composites confirmed the grind size selection of 150µm.
Overall master composites were created for bulk flotation to produce concentrate for leach testing and optimization, primarily regrind size. A regrind target P80 of 20µm was selected for both deposits. Solid liquid separation testing was completed on the Florida Mountain flotation tailing and is planned for the concentrate leach tailing, and both flotation tailing and concentrate leach tailing from DeLamar. Cyanide Detox testing is also planned for the concentrate leach tailing streams.
All Florida Mountain composites and two DeLamar composites underwent Bond Ball Mill Work Index and Abrasion Index testing. Crusher Work Index testing was completed on various composites.
Two composite flotation concentrate samples from DeLamar were sent for scoping level Albion Process testing at SGS Lakefield. The proprietary Albion Process employs ultra-fine grinding + atmospheric oxidation followed by agitated cyanidation. Results showed significant gold and silver recovery improvements from the concentrates compared to ultra-fine regrind-cyanide leach. Flotation with Albion processing of the flotation concentrate indicated over 80% total recovery for both gold and silver from Sullivan Gulch material and over 70% total recovery for both gold and silver from the Glen Silver material. Future test work is planned for further investigation into the Albion Process.
Minerology
Head splits of certain composites were submitted to Vidence, Inc. (“Vidence”) in Burnaby, British Columbia, for mineralogical and textural characterization. Vidence uses QEMSCAN technology for modal mineralogy and texture. More detailed gold and silver deportment QEMSCAN type mineralogical analyses and diagnostic lech tests were conducted on select (5) DeLamar Non-Oxide composites by BV Minerals, in Richmond, British Columbia.
Process Design
Heap Leaching Process
Despite the differences between the 2 deposits, the most economic processing of each requires essentially the same flowsheets.
Crushing will be done in three stages with a primary gyratory crusher, one secondary crusher in open circuit fed from the Heap Leach Coarse Ore stockpile via three reclaim feeders, and two closed circuit tertiary cone crushers to a nominal P80 of 12.7mm (0.5 inch). The primary crusher is sized to handle both Heap Leach and Mill throughputs.
Ore will be placed on the pads primarily by overland conveying, grasshopper conveyors, and a radial stacker. An agglomeration drum will be added to the process for year 2 production when DeLamar ores are introduced. There are three phases of pad construction, starting on the Jacob’s Ridge Pad, then building out 2 phases of the Valley Pad. Each will have dedicated pregnant solution collection ponds and event storage.
Recovery of gold and silver will be via Merrill-Crowe, and an onsite laboratory will support Heap Leach and Milling operations.
Milling Process
The Mill circuit will utilize the same primary crusher as the Heap Leach circuit. Crushed ore from the Non-Oxide Coarse Ore Stockpile with be delivered via two reclaim feeders to a 6.7m x 4.6m (22ft x 15ft) 2985 kW (4000 HP) SAG Mill with pebble recycle. SAG screen undersize will report to a 4.6m x 9.1m (15ft x 30ft) 2985 kW (4000 HP) Ball Mill in closed circuit with cyclones to produce a P80 of 150µm for rougher flotation. Concentrate will be reground to a P80 of 20µm via a 1120 kW (1500 HP) IsaMill.
Concentrate will be leached in 6 agitated tanks utilizing gravity flow with a residence time of 24 hours. Leached slurry will then report to a tank and cyclone CCD circuit for pregnant solution separation, which will report to the Heap Leach Merrill-Crowe circuit.
Non-cyanide contacted flotation tailing will be stored in a separate facility from the leached concentrate. After detoxification, concentrate leach tailing will be blended at a 1:1 ratio with coarser flotation tailing to aid in settling. The concentrate leach tailing storage facility will also act as emergency heap leach solution storage.
To view the Heap Leach Flow Sheet, click on the following link:
https://integraresources.com/site/assets/files/2572/heap_leach_fs_pfs.pdf
To view the Mill Flow Sheet, click on the following link:
https://integraresources.com/site/assets/files/2572/mill_fs_pfs.pdf
To view a Project site map, click on the following link:
https://integraresources.com/site/assets/files/2572/site_map_pfs.pdf
3. Stage 1 Heap Leach
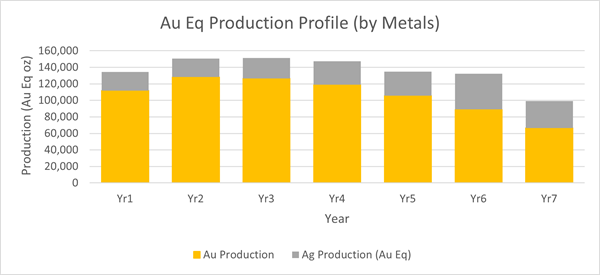
- Average annual production of 136,000 oz Au Eq over a 7-year mine life.
- LOM total payable production of 749,000 oz Au and 16.2 million oz Ag (954,000 oz AuEq).
- US$459 million after-tax LOM cumulative cash flow and average after-tax annual cash flow of US$102 million.
- 35,000 mtpd open pit, sourcing Oxide and Mixed ore from DeLamar and Florida Mountain Deposits.
- LOM site level AISC of US$813/oz on an AuEq co-product basis.
- A low LOM strip ratio of 1.35 (waste:ore).
- Low pre-production Capex of US$273 million (excluding working capital/bonding)
Table 6: Heap Leach Detailed Assumptions:
| Contained Metals |
| Contained Gold ounces (000's oz) | 1,040 |
| Contained Silver ounces (000's oz) | 43,965 |
| Contained AuEq ounces (000's oz) | 1,596 |
| Mining |
| Mine Life | 7 years |
| Strip Ratio (Waste: Ore) | 1.35 |
| Total Tonnage Mined (000's mt) | 190,621 |
| Total Ore Mined (000's mt) | 81,126 |
| Processing |
| Processing Throughput: Heap Leaching | 35,000 mtpd |
| Average Diluted Gold Grade (g/t) - HL | 0.40 |
| Average Diluted Silver Grade (g/t) - HL | 16.86 |
| Average Diluted AuEq Grade (g/t) - HL | 0.61 |
| Production |
| Heap Leach Recovery |
| Florida Heap Leach Recovery (%) - Gold | 76% |
| DeLamar Heap Leach Recovery (%) - Gold | 67% |
| Florida Heap Leach Recovery (%) - Silver | 47% |
| DeLamar Heap Leach Recovery (%) - Silver | 32% |
| Payable Metals |
| LOM Payable Gold ounces (000's oz) | 749 |
| LOM Payable Silver ounces (000's oz) | 16,207 |
| LOM Payable AuEq ounces (000's oz) | 954 |
| Years 1-7 Avg Annual Production - Gold (000's oz) | 107 |
| Years 1-7 Avg Annual Production - Silver (000's oz) | 2,297 |
| Years 1-7 Avg Annual Production - AuEq (000's oz) | 136 |
| Costs per Tonne |
| Mining Costs ($/t mined) | $1.85 |
| Mining Costs ($/t processed) | $4.34 |
| Processing Costs ($/t processed) | $3.80 |
| G&A Costs ($/t processed) | $0.60 |
| Total Site Operating Cost ($/t processed) | $8.74 |
| Cash Costs1 |
| LOM Cash Cost ($/oz) Au, net-of-silver by-product | $510 |
| LOM Cash Cost ($/oz) AuEq, co-product | $765 |
| LOM Site Level AISC ($/oz) Au, net-of-silver by-product | $570 |
| LOM Site Level AISC ($/oz) AuEq, co-product | $813 |
| Capital Expenditures |
| Initial Capital Expenditures ($ MM)2 | $273.1 |
| Working Capital / Reclamation Bond ($ MM)3 | $23.3 |
| Sustaining Capex / Equipment Financing Pmts ($ MM) | $78.1 |
| Reclamation Cost ($ MM) | $24.8 |
| Salvage Value ($ MM) | ($24.0) |
Notes:
(1) Cash costs and AISC are non-GAAP measures. See reference below regarding non-GAAP measures.
(2) Assumes equipment financing for primary equipment only (10% cash deposit)
(3) Working capital and reclamation bonding returned in year 8. Reclamation bond assumes 20% cash collateral.
Gold Equivalent Production Profile (breakdown by metals):
A chart accompanying this announcement is available at https://www.globenewswire.com/NewsRoom/AttachmentNg/62a8bd98-510e-40ce-9c4c-2502d7a05e7e
4. Detailed Capital and Operating Costs
The breakdown of open pit pre-production, capital equipment, and expansion and sustaining capital costs are summarized in the tables below.
Table 7: DeLamar Pre-Production Cost Estimates (US$ Million)
| |
Heap Leach + Mill Stage1
|
Heap Leach Stage1 |
| Mine | | |
| Mining Equipment (2) | $28.9 | $28.6 |
| Pre-Stripping | $12.7 | $6.5 |
| Other Mine Capital | $1.9 | $1.9 |
| Sub-Total Mine | $43.5 | $37.0 |
| Processing | | |
| Heap Leach Pad | $42.3 | $42.3 |
| Oxide Plant (incl. Crushing and Stacking) | $165.2 | $165.2 |
| Stormwater Impoundment | $- | $2.8 |
| Tailing Facilities | $3.8 | $- |
| Sub-Total Processing | $211.3 | $210.3 |
| Infrastructure | | |
| Power | $3.5 | $3.5 |
| Water Treatment Plant and Access Road | $15.1 | $15.1 |
| Other | $1.6 | $1.6 |
| Sub-Total Infrastructure | $20.1 | $20.1 |
| Owner’s Costs | $7.0 | $5.7 |
| Sub-Total Pre-Production | $281.9 | $273.1 |
| Other | | |
| Working Capital (3) | $19.5 | $18.3 |
| Cash Deposit for Reclamation Bonding (4) | $6.2 | $5.0 |
| Total | $307.5 | $296.4 |
Notes:
(1) Figures in the table include contingency. 20% contingency for processing, tailing storage and Heap Leach.
(2) Includes cost of Railveyor. Assumes equipment financing for primary mobile equipment only (10% cash deposit).
(3) Working capital returned in year 17 in Stage 1 and 2 and year 8 in Stage 1 if the Company chooses not to build the Mill.
(4) Cash deposit = 20% of bonding requirement. Released once reclamation is completed.
Table 8: DeLamar Expansion and Sustaining Capital Cost Estimates (US$ Million)
| |
Heap Leach + Mill Stage1
|
Heap Leach Stage1
|
| Mine | | |
| Mining Equipment (2) | $82.6 | $57.0 |
| Other Mine Capital | $0.2 | $0.2 |
| Sub-Total Mine | $82.8 | $57.3 |
| Processing | | |
| Heap Leach Pad | $11.0 | $11.0 |
| Oxide Plant | $8.8 | $8.8 |
| Non-Oxide Plant | $132.0 | $- |
| Tailing Facilities | $58.8 | $- |
| Sub-Total Processing | $210.7 | $19.9 |
| Infrastructure | | |
| Other | $1.0 | $1.0 |
| Sub-Total Infrastructure | $1.0 | $1.0 |
| Sub-Total Expansion/Sustaining | $294.5 | $78.1 |
Notes:
(1) Figures in the table include contingency. 20% contingency for processing, tailing storage and Heap Leach.
(2) Includes cost of Railveyor. Assumes equipment financing for primary mobile equipment only (10% cash deposit / five-year payment period)
Table 9: Operating Cost Estimates (US$/t)
| Item |
Heap Leach + Mill Stage
|
Heap Leach Stage
|
| Mining ($/t mined) | $1.89 | $1.85 |
| Mining ($/t processed) | $6.08 | $4.34 |
| Processing Heap Leach ($/t Heap Leached) | $3.74 | $3.80 |
| Processing Mill ($/t milled) | $12.57 | N/A |
| Processing Combined ($/t processed) | $5.99 | $3.80 |
| G&A ($/t processed) | $0.86 | $0.60 |
| Total onsite operating costs ($/t processed) | $12.92 | $8.74 |
Table 10: Cash Cost and Site Level All-In Sustaining Cost (US$/oz)1
| | Heap Leach + Mill
| Heap Leach Stage
|
| | By-Product
($/oz Au) | Co-Product
($/oz AuEq) | By-Product
($/oz Au) | Co-Product ($/oz AuEq) |
| Mining | $646 | $418 | $465 | $365 |
| Processing | $640 | $414 | $409 | $321 |
| G&A | $92 | $59 | $65 | $51 |
| Total Onsite Costs | $1,378 | $891 | $939 | $738 |
| Refining, transport | $27 | $17 | $16 | $12 |
| Total Cash Costs (Before Royalties) | $1,405 | $908 | $955 | $750 |
| Royalties | $23 | $15 | $20 | $15 |
| Total Cash Costs (Incl. Royalties) | $1,428 | $923 | $975 | $765 |
| Silver By-Products | ($931) | N/A | ($465) | N/A |
| Total Cash Costs Net of Silver By-Product | $497 | $923 | $510 | $765 |
| Sustaining Capex | $50 | $32 | $60 | $47 |
| Site Level All-In Sustaining Cost | $547 | $955 | $570 | $813 |
Notes:
(1) Cash costs and AISC are non-GAAP measures. See reference below regarding non-GAAP measures.
5. Sustainability-Driven Considerations
From the outset of the PFS study process, Integra has been closely engaged with ESG consultants to evaluate alternatives to more traditional mining methods. The PFS includes multiple ESG-driven initiatives to decrease the environmental footprint of the Project. As part of the Project’s haulage system, the operation will utilize Railveyor’s light rail system. Composed of a light rail train cars propelled by stationary drive stations, Railveyor is controlled and optimized by sophisticated automation software. The system will be employed for the long-distance portions of the haulage routes between various pits and the processing location, replacing the equivalent of approximately 5 diesel haul trucks. Powered electrically, Railveyor will decrease the Project’s diesel usage, and will decrease the associated direct (Scope 1) greenhouse gas emissions. In addition to Railveyor, the Company will continue to evaluate the feasibility of other electric and low-emissions equipment.
The Company plans to power the Project through an onsite microgrid consisting of a hybridized system of solar, battery, and LNG generators. 12 MW of electricity will be delivered by a solar array constructed on the historic tailing impoundment, making beneficial use of the previously impacted portions of the Project site. The solar array has been sized to fit an average of 11 MW of energy demand that is present for most of the life of mine. During higher production years, when the mine demand jumps to 25 MW, an LNG power plant will supply the additional 13 MW not supplied by solar. Fluctuations in demand or drops in solar production will, in the short term, be handled by a bank of batteries as the LNG generators adjust to the load. The LNG power plant is sized to handle the maximum mine demand of 25 MW when solar production is not available. This microgrid will be constructed on site and leased from a third-party provider through a long-term use-based equipment lease. Greenhouse gas emissions from this energy mix will be an estimated 13 percent lower than the current local utility grid mix, based on the local utility’s most recently published GHG emissions intensity. The microgrid levelized cost of energy (LCOE) is 63 percent lower than the local electric utility. The LCOE comparison includes the capital infrastructure cost differences between a large powerline upgrade and the microgrid infrastructure. While solar will meet 19 percent of the total energy consumed over LOM, The Company will continue to look at how to affordably increase the percent of energy provided by renewables while ensuring energy reliability.
These sustainability-driven initiatives are deeply integrated into core aspects of the operation – the haulage of ore, and the mine’s power supply. The incorporation of these plans is not only crucial to lowering the Project’s environmental footprint, but they also importantly drive stronger economics for the Project, demonstrating how mining projects can benefit economically from taking steps towards sustainability.
6. DeLamar: Future Opportunities and Value Enhancements:
The Albion Process: Unlocking more value from the Non-Oxide material
The Project has a large Non-Oxide component at the DeLamar Deposit, only some of which is included as Mineral Reserves in this PFS. A significant amount of Non-Oxide gold and silver bearing sulfide material could be amenable to the Albion Process (“Albion”) for improving gold and silver recoveries. It was developed in 1994 by Glencore and is patented worldwide.
Albion has a much lower capital cost than traditional Oxidation plants, like pressure oxidation (POx). Since the Albion Process operates at atmospheric pressure, it avoids risks associated with POx plants.
Albion is a combination of ultrafine grinding and oxidative leaching at atmospheric pressure. The feed to the Albion Process is base or precious metal concentrates. The sulfides in the feed are oxidized and valuable metals liberated, with the economic metals recovered by conventional downstream processing.
Albion could be considered as an expansion circuit to the Mill once the DeLamar Deposit Non-Oxides are being processed.
Florida Mountain High-Grade Exploration
The Company has intersected more than 100 drill hits over 4.0 g/t AuEq with a minimum width of 1.52 meters at the Florida Mountain Deposit. The majority of these drill intercepts occur outside the existing Mineral Resource envelope at the Florida Mountain Deposit and demonstrate the potential for a high-grade deposit below the Florida Mountain Deposit that could be included in future studies. Additional high-grade Non-Oxide material from below Florida Mountain Deposit has the potential to improve the already strong economics presented in this PFS.
7. Permitting Considerations
The Project is a closed/reclaimed mine with existing permits for mine water discharge and surface disturbance under previous agency approval and a previously approved Environmental Assessment (“EA”) and Environmental Impact Statement (“EIS”) for mining. The site has been in care and maintenance since reclamation and closure activities ceased in 2013 and remains in good standing. A historic environmental database of information dating back 40 plus years has been retained at the site if needed for future permitting efforts. To accommodate the proposed mine design in the PFS, an EIS will be required with the Bureau of Land Management (“BLM”) (lead permitting agency on the DeLamar Mine Project) as well as additional permitting with other cooperating agencies.
Baseline surveys in support of the EIS mine features were conducted for the following resources: Aquatic Resources, Cultural Resources, Wildlife, Vegetation, Wetlands Seeps and Springs, Soils, Surface and Groundwater Sampling studies have been underway since early 2020. In addition to surveys conducted, geochemical samples were selected to initiate geochemical characterization of mine features as well as installation of a PM 10 monitor to provide site-specific baseline air conditions. Baseline Survey Reports have been submitted to the agencies and are under review. These baseline reports will serve as the basis for the Draft Environmental Impact Statement (“DEIS”) that will be developed subsequent to the submittal of the Mine Plan of Operations (“MPO”) in H1 2023. Baseline studies for the mine access corridor and any potential power alignment will be conducted in 2022 with reports submitted to the agency in late 2022 early 2023. Integra completed the installation of the groundwater monitoring well network in order to initiate collection of baseline groundwater data to support the Point of Compliance necessary for the operation of the mine.
Initial project coordination and integration has occurred with the following agencies in 2021: BLM, Idaho Department of Lands, Idaho Department of Environmental Quality, Idaho Department of Fish and Game, Idaho Department of Water Resources, U.S. Army Corps of Engineers and the Idaho Office of Energy and Mineral Resources (“OEMR”) and will continue for the duration of the project. Coordination with Office of Species Conservation (“OSC”) has initiated to begin early discussions on potential concerns regarding Sage Grouse.
Integra has identified the following additional studies to be initiated in 2022 in an effort to de-risk the DeLamar Project include:
- Drilling Plan of Operations EA for regional exploration drilling as well as site drilling for Geotechnical, Geochemical, Condemnation, Metallurgical and subsurface hydrogeology monitoring,
- Additional hydrological studies focused on aquifer testing and characterization, groundwater modeling, meteoric water balance and transport modeling for closure activity planning,
- Geochemical waste rock studies for site facilities, and;
- Reclamation closure planning.
8. Next Steps:
The Company will resume drilling at the Project in late February. Drilling will begin at Sullivan Gulch in order to further test the potential of this target and provide additional material for further metallurgical test work. Sullivan Gulch is a primarily Non-Oxide target where Albion could result in more material being brought into future mine plans and higher overall recoveries for material included in this PFS. Integra will continue to advance the engineering for all aspects of the project, including metallurgy, mine and plant design, geotechnical and condemnation drilling parallel with all ongoing permitting activities.
Sampling and QA/QC Procedure
Thorough QA/QC protocols are followed on the Project, including insertion of duplicate, blank and standard samples in the assay stream for all drill holes. The samples are submitted directly to American Assay Labs in Reno, Nevada for preparation and analysis. Analysis of gold is performed using fire assay method with atomic absorption (AA) finish on a 1 assay ton aliquot. Gold results over 5 g/t are re-run using a gravimetric finish. Silver analysis is performed using ICP for results up to 100 g/t on a 5-acid digestion, with a fire assay, gravimetric finish for results over 100 g/t silver.
Additional supporting details regarding the information in this news release, will be provided in the PFS technical report which will be available on SEDAR under the Company’s profile within 45 days of this news release, including all qualifications, assumptions and exclusions that relate to the PFS. The PFS technical report is intended to be read as a whole, and sections should not be read or relied upon out of context.
Qualified Person
Thomas L. Dyer, PE, Principal Engineer and Michael Gustin, C.P.G., of Mine Development Associates, a division of RESPEC of Reno, Nevada are independent Qualified Persons as defined by NI43-101 and have reviewed and approved the contents of this news release.
Matthew Sletten, PE, Project Manager of M3 Engineering & Technology Corporation of Chandler, Arizona, is an independent Qualified Person as defined by NI43-101 and has reviewed and approved the contents of this news release.
Art Ibrado, PhD, PE, Consulting Metallurgist of Fort Lowell Consulting PLLC of Tucson, Arizona, working with M3 Engineering & Technology Corporation, is an independent Qualified Person as defined by NI43-101 and has reviewed and approved the contents of this news release.
Jack McPartland, a member of MMSA, with a special expertise in metallurgy/processing, of McClelland Laboratories of Reno, Nevada is an independent Qualified Person as defined by NI43-101 and has reviewed and approved the contents of this news release.
John D. Welsh, P.E., President and Senior Principal of Welsh Hagen Associates, Inc is an independent Qualified Person as defined by NI43-101 and has reviewed and approved the contents of this news release.
Richard DeLong, Qualified Person with the Mining & Metallurgical Society of America of EM Strategies, a WestLand Resources, Inc, Company of Reno, Nevada is an independent Qualified Person as defined by NI43-101 and has reviewed and approved the contents of this news release.
Dr. John Gardner, Ph.D., P.E., Senior Engineering Advisor, of Warm Springs Consulting, LLC of Boise, Idaho, is an independent Qualified Person as defined by NI43-101 and has reviewed and approved the contents of this news release related to the microgrid design and performance.
The scientific and technical information contained in this news release has been reviewed and approved by E. Max Baker Ph.D. (F.AusIMM), Integra’s Vice President Exploration, and Timothy D. Arnold (PE, SME), Integra’s Chief Operating Officer, both of Reno, Nevada. Each is a “Qualified Person” (“QP”) as defined in NI43-101.
If you would like to book a meeting with management to discuss further, please click on the following link:
https://vrify.com/meetings/book/8
About Integra Resources
Integra is a development-stage mining company focused on the exploration and de-risking of the past producing DeLamar Gold-Silver Project in Idaho, USA. Integra is led by the management team from Integra Gold Corp. which successfully grew, developed and sold the Lamaque Project, in Quebec, for C$600 M in 2017. Since acquiring the DeLamar Project, which includes the adjacent DeLamar and Florida Mountain gold and silver Deposits, in late 2017, the Company has demonstrated significant resource growth and conversion while providing a robust economic study in its maiden Preliminary Economic Assessment. The Company is currently focused on resource growth through brownfield and greenfield exploration and the delivery of a Pre-Feasibility Study. An independent technical report for the PFS on the DeLamar Project prepared in accordance with the requirements of NI 43-101 will be available under the Company’s SEDAR profile within 45 days of this news release.
ON BEHALF OF THE BOARD OF DIRECTORS
George Salamis
President, CEO and Director
CONTACT INFORMATION
Corporate Inquiries: ir@integraresources.com
Company website: www.integraresources.com
Office phone: 1 (604) 416-0576
Forward-Looking Statements
Certain information set forth in this news release contains “forward-looking statements” and “forward-looking information” within the meaning of applicable Canadian securities legislation (referred to herein as forward-looking statements) and applicable United States securities laws. Except for statements of historical fact, certain information contained herein constitutes forward-looking statements which includes, but is not limited to, statements with respect to: the future financial or operating performance of the Company and the Project; results from work performed to date; the estimation of mineral resources and reserves; the realization of mineral resource and reserve estimates; the development, operational and economic results of the PFS for the DeLamar and Florida Mountain Deposits, including cash flows, revenue potential, staged development, capital expenditures, development costs and timing thereof, extraction rates, life of mine projections and cost estimates; timing of completion of a technical report summarizing the results of the PFS; magnitude or quality of mineral deposits; anticipated advancement of the Project mine plan; exploration expenditures, costs and timing of the development of new deposits; underground exploration potential; costs and timing of future exploration; the completion and timing of future development studies; estimates of metallurgical recovery rates, including prospective use of the Albion process; anticipated advancement of the Project and future exploration prospects; requirements for additional capital; the future price of metals; government regulation of mining operations; environmental risks; the timing and possible outcome of pending regulatory matters; the realization of the expected economics of the Project; future growth potential of the Project; and future development plans. Forward-looking statements are often identified by the use of words such as “may”, “will”, “could”, “would”, “anticipate”, ‘believe”, expect”, “intend”, “potential”, “estimate”, “budget”, “scheduled”, “plans”, “planned”, “forecasts”, “goals” and similar expressions. Forward-looking statements are based on a number of factors and assumptions made by management and considered reasonable at the time such information is provided. Assumptions and factors include: the Company’s ability to complete its planned exploration programs; the absence of adverse conditions at the Project; no unforeseen operational delays; no material delays in obtaining necessary permits; the price of gold remaining at levels that render the Project economic; the Company’s ability to continue raising necessary capital to finance operations; and the ability to realize on the mineral resource and reserve estimates. Forward-looking statements necessarily involve known and unknown risks and uncertainties, which may cause actual performance and financial results in future periods to differ materially from any projections of future performance or result expressed or implied by such forward-looking statements. These risks and uncertainties include, but are not limited to: general business, economic and competitive uncertainties; the actual results of current and future exploration activities; conclusions of economic evaluations; meeting various expected cost estimates; benefits of certain technology usage; changes in project parameters and/or economic assessments as plans continue to be refined; future prices of metals; possible variations of mineral grade or recovery rates; the risk that actual costs may exceed estimated costs; geological, mining and exploration technical problems; failure of plant, equipment or processes to operate as anticipated; accidents, labour disputes and other risks of the mining industry; delays in obtaining governmental approvals or financing; the speculative nature of mineral exploration and development (including the risks of obtaining necessary licenses, permits and approvals from government authorities); title to properties; the impact of COVID-19 on the timing of exploration and development work and management’s ability to anticipate and manage the foregoing factors and risks. Although the Company has attempted to identify important factors that could cause actual actions, events or results to differ materially from those described in the forward-looking statements, there may be other factors that cause actions, events or results not to be as anticipated, estimated or intended. Readers are advised to study and consider risk factors disclosed in the Company’s annual information form dated March 12, 2021 for the fiscal year ended December 31, 2020 and the Company’s Form 40-F annual report for the year ended December 31, 2020.
There can be no assurance that forward-looking statements will prove to be accurate, as actual results and future events could differ materially from those anticipated in such statements. The Company undertakes no obligation to update forward-looking statements if circumstances or management’s estimates or opinions should change except as required by applicable securities laws. The forward-looking statements contained herein is presented for the purposes of assisting investors in understanding the Company’s plan, objectives and goals and may not be appropriate for other purposes. Forward-looking statements are not guarantees of future performance and the reader is cautioned not to place undue reliance on forward-looking statements. This news release also contains or references certain market, industry and peer group data which is based upon information from independent industry publications, market research, analyst reports and surveys and other publicly available sources. Although the Company believe these sources to be generally reliable, such information is subject to interpretation and cannot be verified with complete certainty due to limits on the availability and reliability of raw data, the voluntary nature of the data gathering process and other inherent limitations and uncertainties. The Company has not independently verified any of the data from third party sources referred to in this news release and accordingly, the accuracy and completeness of such data is not guaranteed.
Cautionary Note for U.S. Investors Concerning Mineral Resources and Reserves
National Instrument 43-101 - Standards of Disclosure for Mineral Projects ("NI 43-101") is a rule of the Canadian Securities Administrators which establishes standards for all public disclosure an issuer makes of scientific and technical information concerning mineral projects. Technical disclosure contained in this news release has been prepared in accordance with NI 43-101 and the Canadian Institute of Mining, Metallurgy and Petroleum Classification System. These standards differ from the requirements of the U.S. Securities and Exchange Commission (“SEC”) and resource information contained in this press release may not be comparable to similar information disclosed by domestic United States companies subject to the SEC's reporting and disclosure requirements.
All references to “$” in this news release are to U.S. dollars unless otherwise stated.
Cautionary Note Regarding Non-GAAP Financial Measures
Alternative performance measures in this news release such as “cash cost”, “AISC” “free cash flow” are furnished to provide additional information. These non-GAAP performance measures are included in this news release because these statistics are used as key performance measures that management uses to monitor and assess performance of the Project, and to plan and assess the overall effectiveness and efficiency of mining operations. These performance measures do not have a standard meaning within International Financial Reporting Standards (“IFRS”) and, therefore, amounts presented may not be comparable to similar data presented by other mining companies. These performance measures should not be considered in isolation as a substitute for measures of performance in accordance with IFRS.
Cash Costs
Cash costs include site operating costs (mining, processing, site G&A), refinery costs and royalties, but excludes head office G&A and exploration expenses. While there is no standardized meaning of the measure across the industry, the Company believes that this measure is useful to external users in assessing operating performance.
All-In Sustaining Cost (“AISC”)
Site level AISC include cash costs and sustaining capital, but excludes head office G&A and exploration expenses. The Company believes that this measure is useful to external users in assessing operating performance and the Company’s ability to generate free cash flow from current operations.
Free Cash Flow
Free cash flows are revenues net of operating costs, royalties, capital expenditures and cash taxes. The Company believes that this measure is useful to the external users in assessing the Company’s ability to generate cash flows from the Project.
Neither the TSX Venture Exchange nor its Regulation Services Provider (as that term is defined in the policies of the TSX Venture Exchange) accepts responsibility for the adequacy or accuracy of this release.